Bandung's air was suddenly great last weekend. So Claude & I investigated.
Bandung’s air is bad again today. PM2.5 at 80 µg/m³, “Unhealthy”, the usual dry-season red bar on IQAir.
But last Saturday and Sunday were amazing. 13 and 18 µg/m³. I opened the daily chart and it looked like someone had deleted two days.
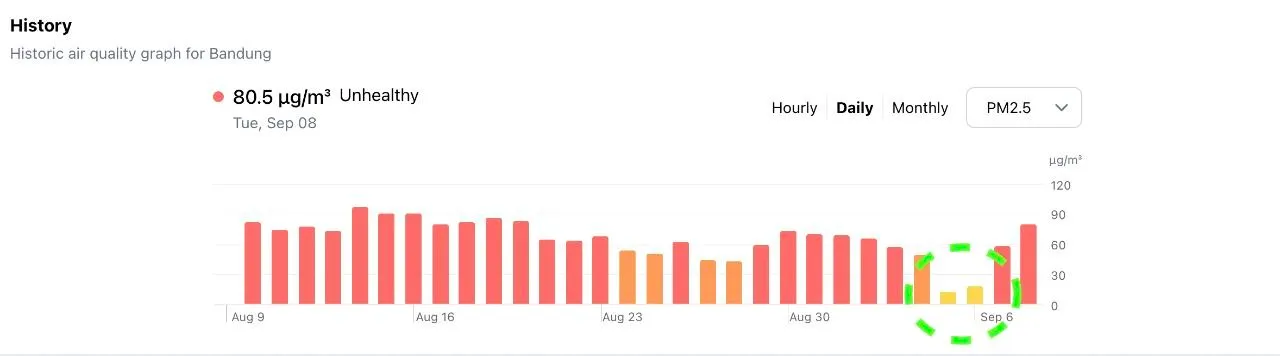
Look at that. A full month of 60–95, then two tiny yellow bars, then straight back to 80. Every other weekend in the chart only dips to 50–70. This one dropped 80%.
So the question is not “why is Bandung polluted today”. Today is normal. The question is what happened last weekend.
I had a few theories, and I investigated them with Claude. Here’s how it went.
Theory 1: The Anak Krakatau eruption
Anak Krakatau erupted on Friday night, 4 September, at 23
. The ash column went up to 15 km. Airports closed, 2,000+ flights cancelled, ash reached Bandung by Saturday afternoon according to BMKG, the national weather agency.The clean weekend started the same night. That’s a hell of a coincidence, so my first thought was that the two must be connected. Maybe the ash aloft did something to the air. Maybe the eruption changed the wind.
Claude’s first answer actually went the other way: it said today’s pollution was the volcanic ash settling down. That sounded plausible until I showed it the daily chart. The chart kills that idea immediately. 80 µg/m³ is just Bandung’s baseline. There’s nothing to explain about today.
Theory 2: The factories
There’s been a lot of news lately about lime factories in Padalarang and concrete plants in Rancaekek covering neighbourhoods in dust “like snow”. Five lime factories in West Bandung were even shut down permanently on 4 August.
If those plants were a major cause of Bandung’s PM2.5, the chart should have stepped down after 4 August. It didn’t. The bars after the closure look exactly like the bars before it. Also, lime and concrete dust is mostly coarse PM10, not the fine PM2.5 that IQAir tracks, and those plants are 20–30 km from the city sensors. Real problem for the people living next to them, but not what makes the whole basin red every day.
Theory 3: People took the weekend off
My last theory: maybe because of the eruption, people just stayed home. Fewer cars, fewer factories running, cleaner air.
This one has a timing problem. The eruption was 200 km away, Bandung wasn’t declared an affected area, nothing closed here that weekend except the airport for four hours on Sunday. Schools in Jakarta and Bogor only switched to remote learning on Monday, which is exactly the day the pollution came back.
And there’s a ceiling on what “people staying home” can do. Even during Lebaran, the Eid holiday, when Bandung’s traffic really disappears for a week, PM2.5 drops 30–50%, not 80%. To get down to 13 µg/m³ you have to physically remove the air that is already sitting in the basin. Only wind or rain does that.
What actually happened: wind
I gave Claude my IQAir API key, but the free tier only returns the current reading. So it pulled weather reanalysis data (ERA5 via Open-Meteo) for Bandung instead, and this is what came out:
| Date | Mean wind | Max wind | Gust | Rain |
|---|---|---|---|---|
| Mon 31 Aug – Fri 4 Sep | 4.0–5.8 km/h | 8.5–10.6 | 32–37 | ~0 |
| Sat 5 Sep | 13.4 km/h | 21.8 | 53.6 | 0 |
| Sun 6 Sep | 9.1 km/h | 11.7 | 36 | 0 |
| Mon 7 Sep | 6.2 km/h | 11.9 | 38 | 0 |
| Tue 8 Sep | 4.8 km/h | 10.4 | 37 | 5 mm |
Saturday’s wind was 2.5× normal, with the strongest gusts in the whole two-week window. BMKG had actually issued a strong-wind warning for West Java on the morning of 4 September, before the eruption, covering the 4th and 5th. I just never read it.
The important detail is what happened at night. Normally Bandung’s wind dies to 2–5 km/h after dark, a shallow inversion forms, and the basin fills up with everything emitted that day. That nightly build-up is where the worst hours come from. On Friday and Saturday nights the wind stayed at 10–11 km/h at the surface and around 20 km/h at 100 m. The inversion never sealed the basin. Nothing accumulated.
IQAir’s hourly history confirms the shape. These are AQI numbers, not µg/m³. Sunday afternoon was AQI 66. Overnight into Monday it only crept up to ~80. Monday daytime stayed 80–98. Then from about 21
Monday, when the wind finally died, it jumped 110 → 136 → 153 → 174 by early Tuesday and has stayed there since. The pollution didn’t come back with Monday’s rush hour. It came back overnight when the air stopped moving.So why the wind?
This is the part I found most interesting. In the dry season the southeast trade winds blow constantly off the Australian high. Over the ocean south of Java that flow is 30 km/h every single day. Bandung normally doesn’t feel it because we sit under our own shallow daily cycle.
On 4–6 September a pressure ridge pushed north over Java. Bandung’s sea-level pressure rose to a two-week high, the north coast barely moved, so the pressure gradient across the island steepened and the trade-wind layer got pushed inland and down onto the plateau. Jakarta and Surabaya didn’t see anything special because they’re at sea level. Bandung at 700 m is high enough to be inside that flow.
And yes, I did ask whether the eruption could have caused the wind. The wind switched on within an hour of the eruption, and it blew from the east, toward Krakatau. Suspicious. But inflow toward an eruption column is a phenomenon of tens of kilometres, not 200, and it can’t sustain a 20 km/h layer across West Java for 40 hours, most of which came after the eruption had stopped. The BMKG warning came first. The pressure ridge is in the data. It’s a coincidence, just a very good one.
Takeaways
Bandung’s pollution is mostly a ventilation problem, not an emission spike. Same emissions every day, the difference is whether the basin gets flushed at night.
Coincidence is a hell of a drug. The eruption, the factory news, the clean weekend, all landing in the same week made me build stories that the data didn’t support. The daily chart was the best evidence I had all along, I just needed someone to make me read it properly.
And the workflow of “here’s my theory, here’s my data, go check” with Claude is really good for this kind of thing. It was wrong at first too, but once it had the chart and the wind data it got to the answer faster than I would have on my own.
Wear a mask this week. The wind’s gone.
Enjoyed this article?
Get future posts delivered to your inbox so you never miss one. You can also follow via RSS feed.
Subscribe via email